CDK Debugging in VSCode


AWS Cloud Development Kit (CDK) is a fantastic way of deploying AWS resources in a programmatic and repeatable way. If you are reading this blog you'll be happy to know that it was deployed and has all its resources managed entirely through CDK. But the benefits of using CDK don't stop at the programmatic syntax!
I was chatting with Dylan Johnston and he helped me setup this awesome workflow for better debugging my Typescript based CDK projects. In this post I'll show you how this works and how you can use it too in order to better debug CDK stacks using VSCode.
Sample Project
To start with we'll create a really simple CDK project. You can find a complete example that I made for this tutorial at t04glovern/aws-cdk-vscode-example
# Install the CDK CLI
npm install -g aws-cdk
# Create a new Typescript project
mkdir aws-cdk-vscode-example && cd aws-cdk-vscode-example
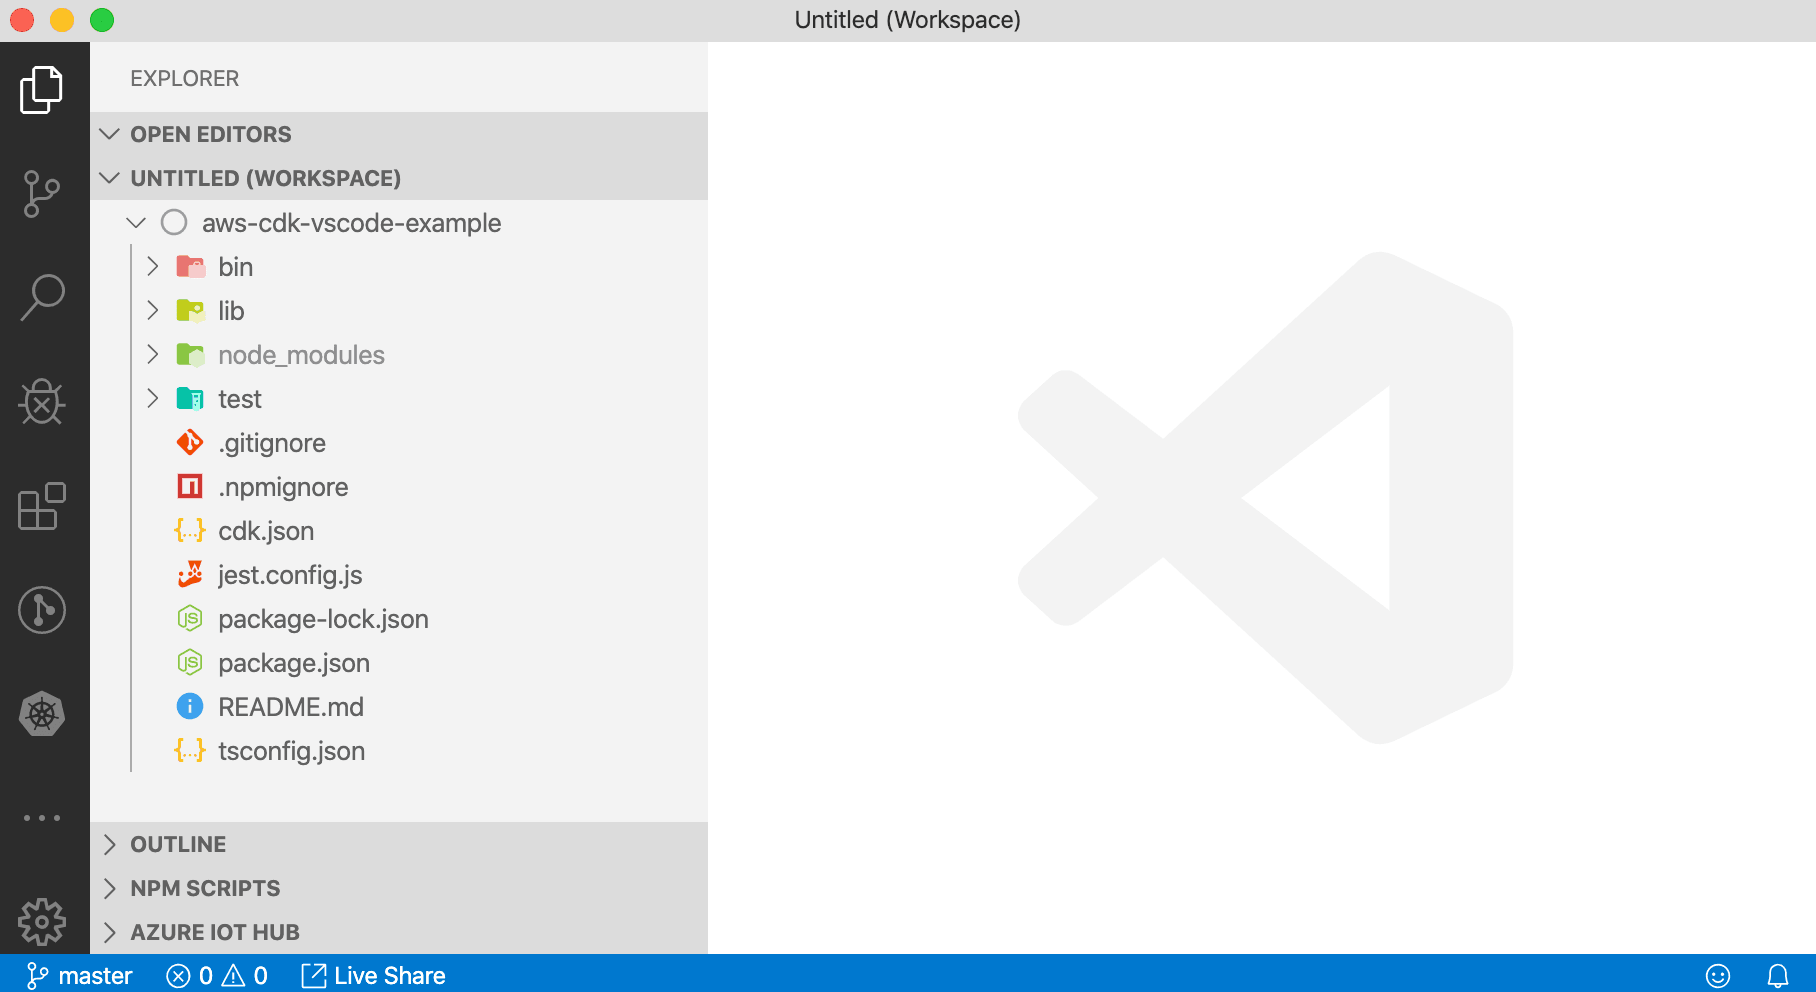
cdk init --language typescriptOpen up the brand-new project in VSCode. You should see something like below.
To make things a little more interesting we'll add some sample resources to play around with. To do this first install the following dependencies (run these commands from within the aws-cdk-vscode-example folder).
npm install
npm install @aws-cdk/aws-lambda
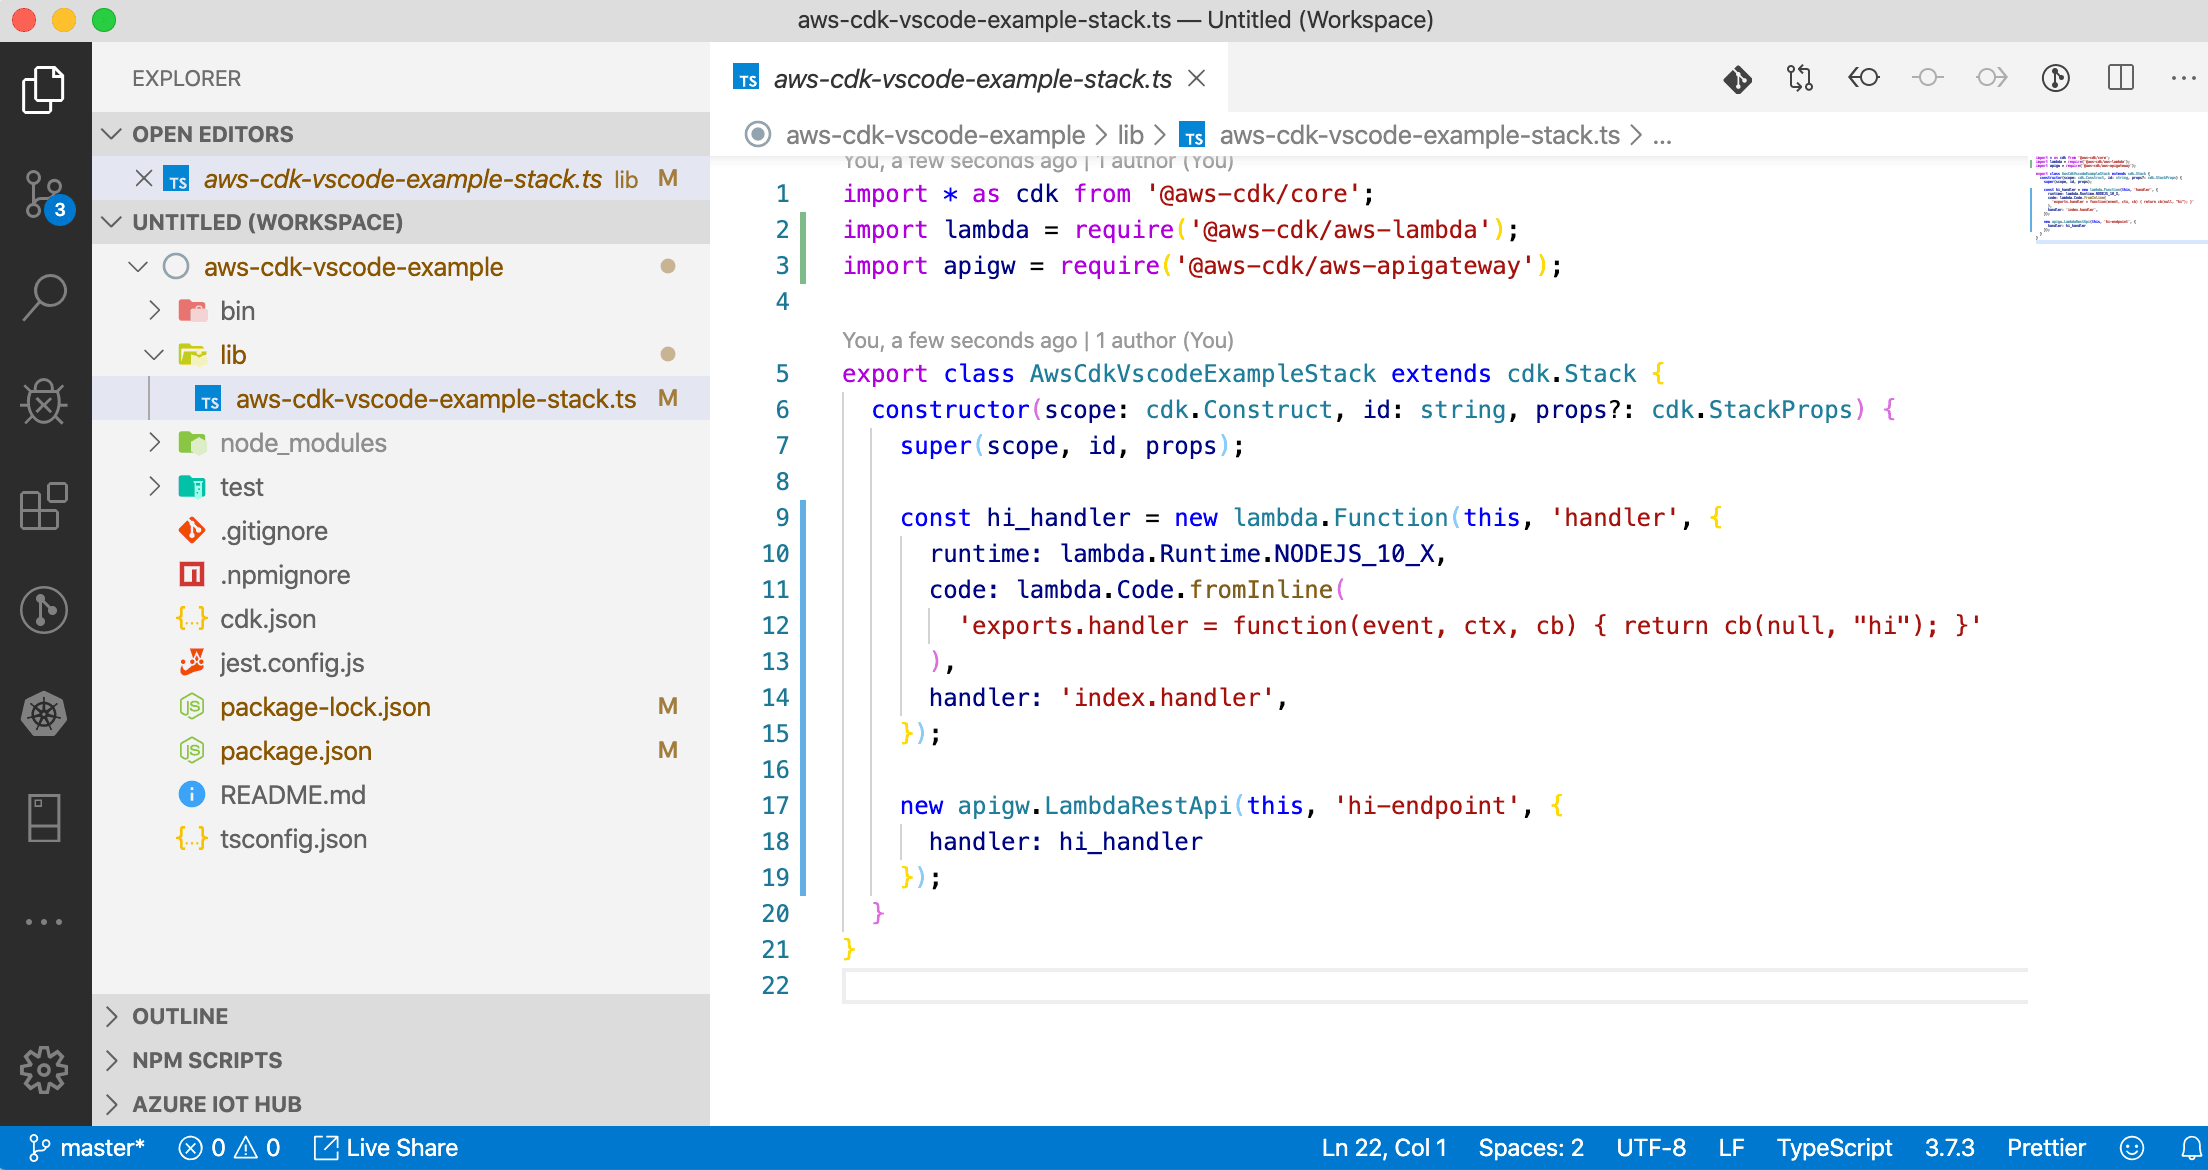
npm install @aws-cdk/aws-apigatewayThen update the lib/aws-cdk-vscode-example-stack.ts file with the following resource definitions. We are just creating:
- AWS Lambda - handler to return the word hi
- Amazon API Gateway - Direct requests to the hi lambda handler
import * as cdk from '@aws-cdk/core';
import lambda = require('@aws-cdk/aws-lambda');
import apigw = require('@aws-cdk/aws-apigateway');

export class AwsCdkVscodeExampleStack extends cdk.Stack {
  constructor(scope: cdk.Construct, id: string, props?: cdk.StackProps) {
    super(scope, id, props);

    const hi_handler = new lambda.Function(this, 'handler', {
      runtime: lambda.Runtime.NODEJS_10_X,
      code: lambda.Code.fromInline(
        'exports.handler = function(event, ctx, cb) { return cb(null, "hi"); }'
      ),
      handler: 'index.handler',
    });

    new apigw.LambdaRestApi(this, 'hi-endpoint', {
      handler: hi_handler
    });
  }
}
It should look like the following. Note that your .ts file might be called something else if your project was named something different.
Debugging
Okay now that we have a project configured, let's setup debugging! To do this in VSCode, create a new folder .vscode and add a file to it called launch.json
mkdir .vscode/
touch .vscode/launch.json
In the launch.json file we need to add the following contents.
NOTE: You will need to change
aws-cdk-vscode-example.tsif this is not the name of the.tsfile that is within thebin/directory.
{
"version": "0.2.0",
"configurations": [
{
"type": "node",
"request": "launch",
"name": "Launch Program",
"skipFiles": [
"<node_internals>/**"
],
"runtimeArgs": [
"-r", "./node_modules/ts-node/register/transpile-only"
],
"args": [
"${workspaceFolder}/bin/aws-cdk-vscode-example.ts"
]
}
]
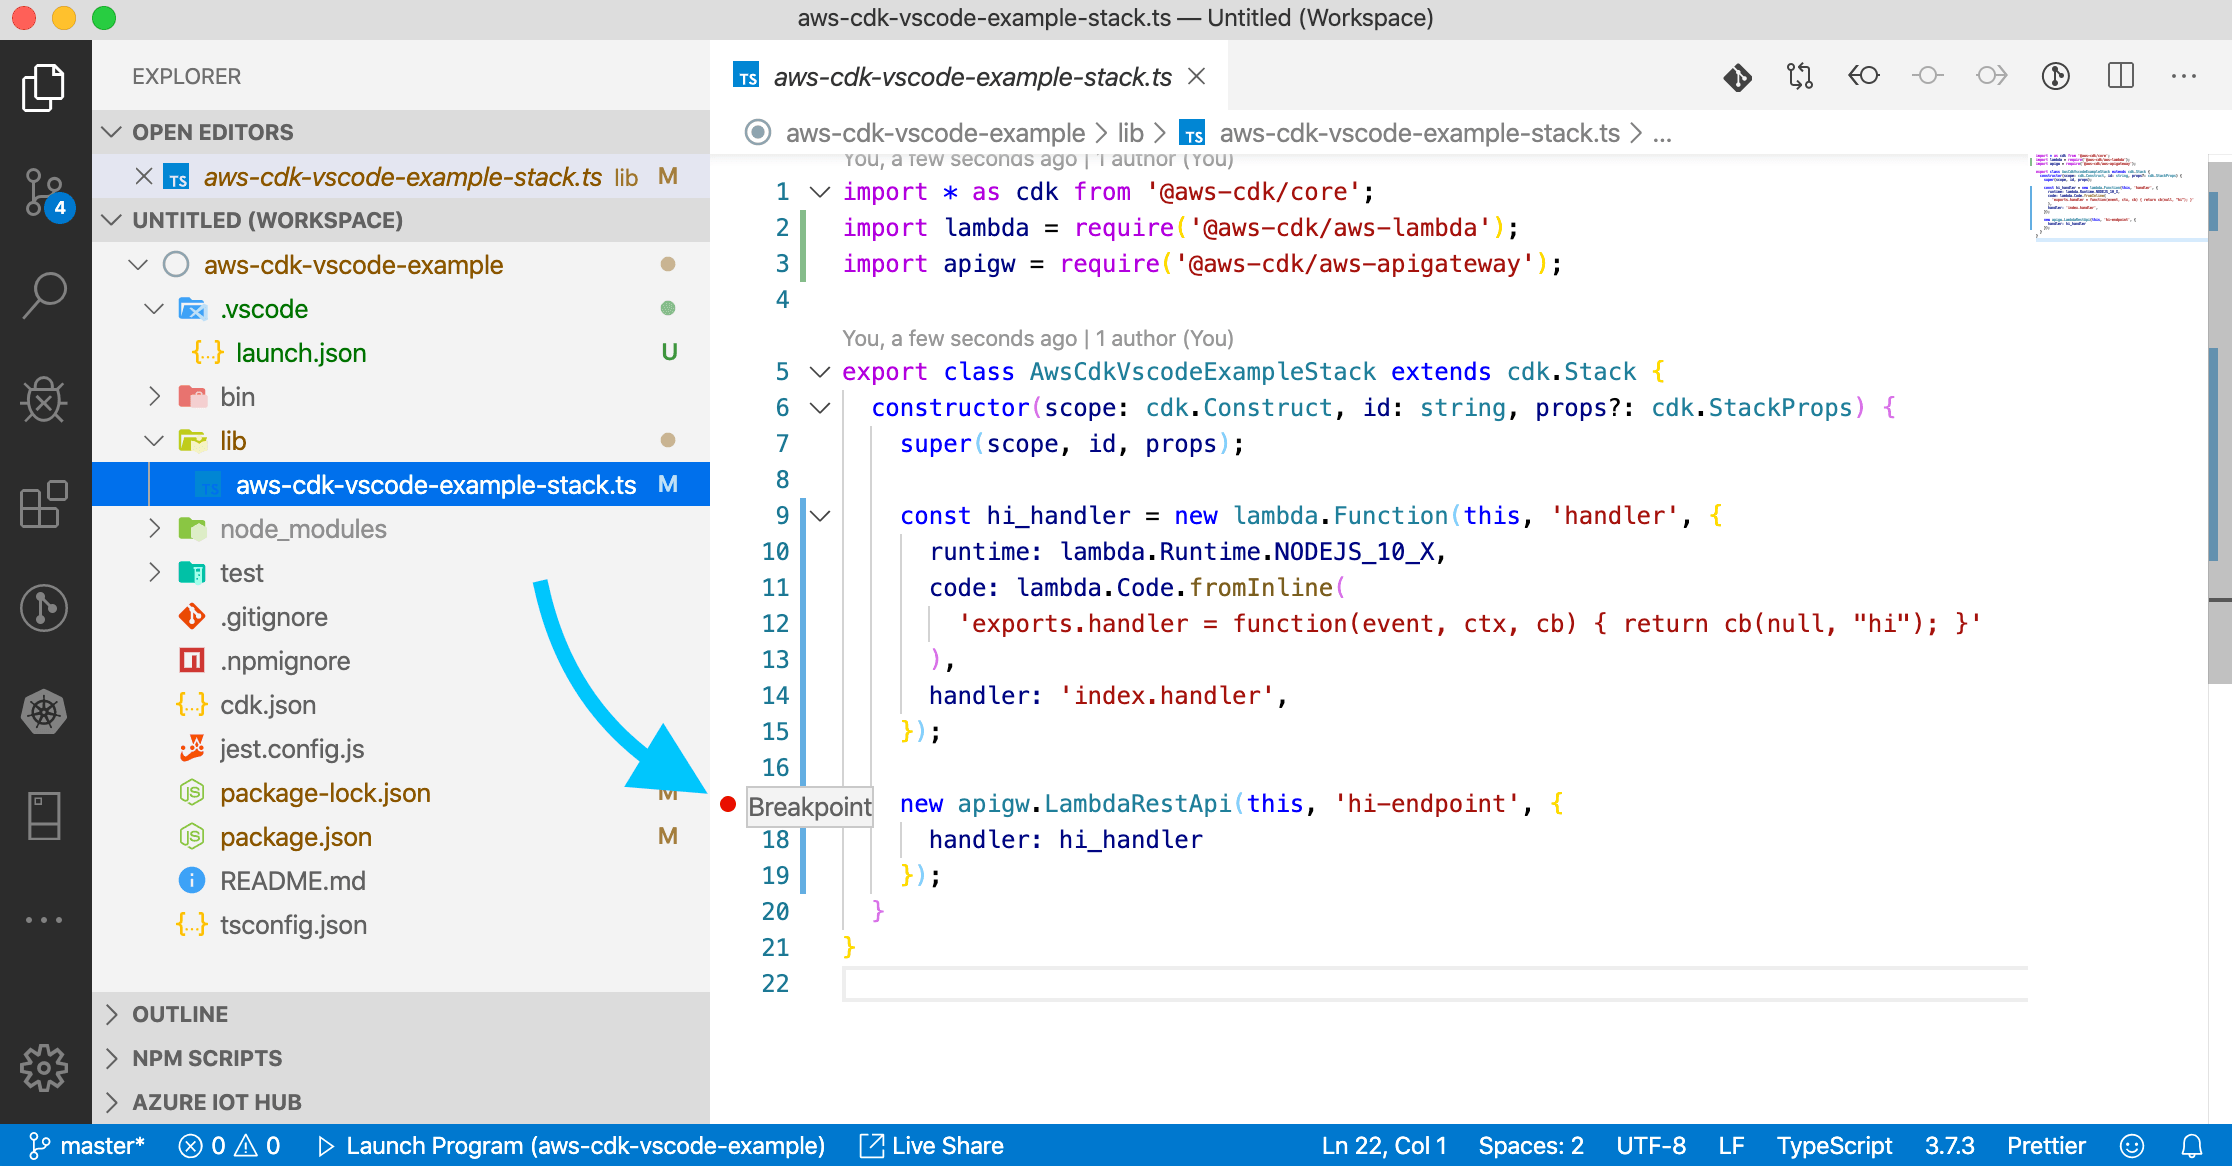
}With debugging configuration setup we're now able to add breakpoints within the CDK code and then get all the fantastic utilities that come from that available to us.
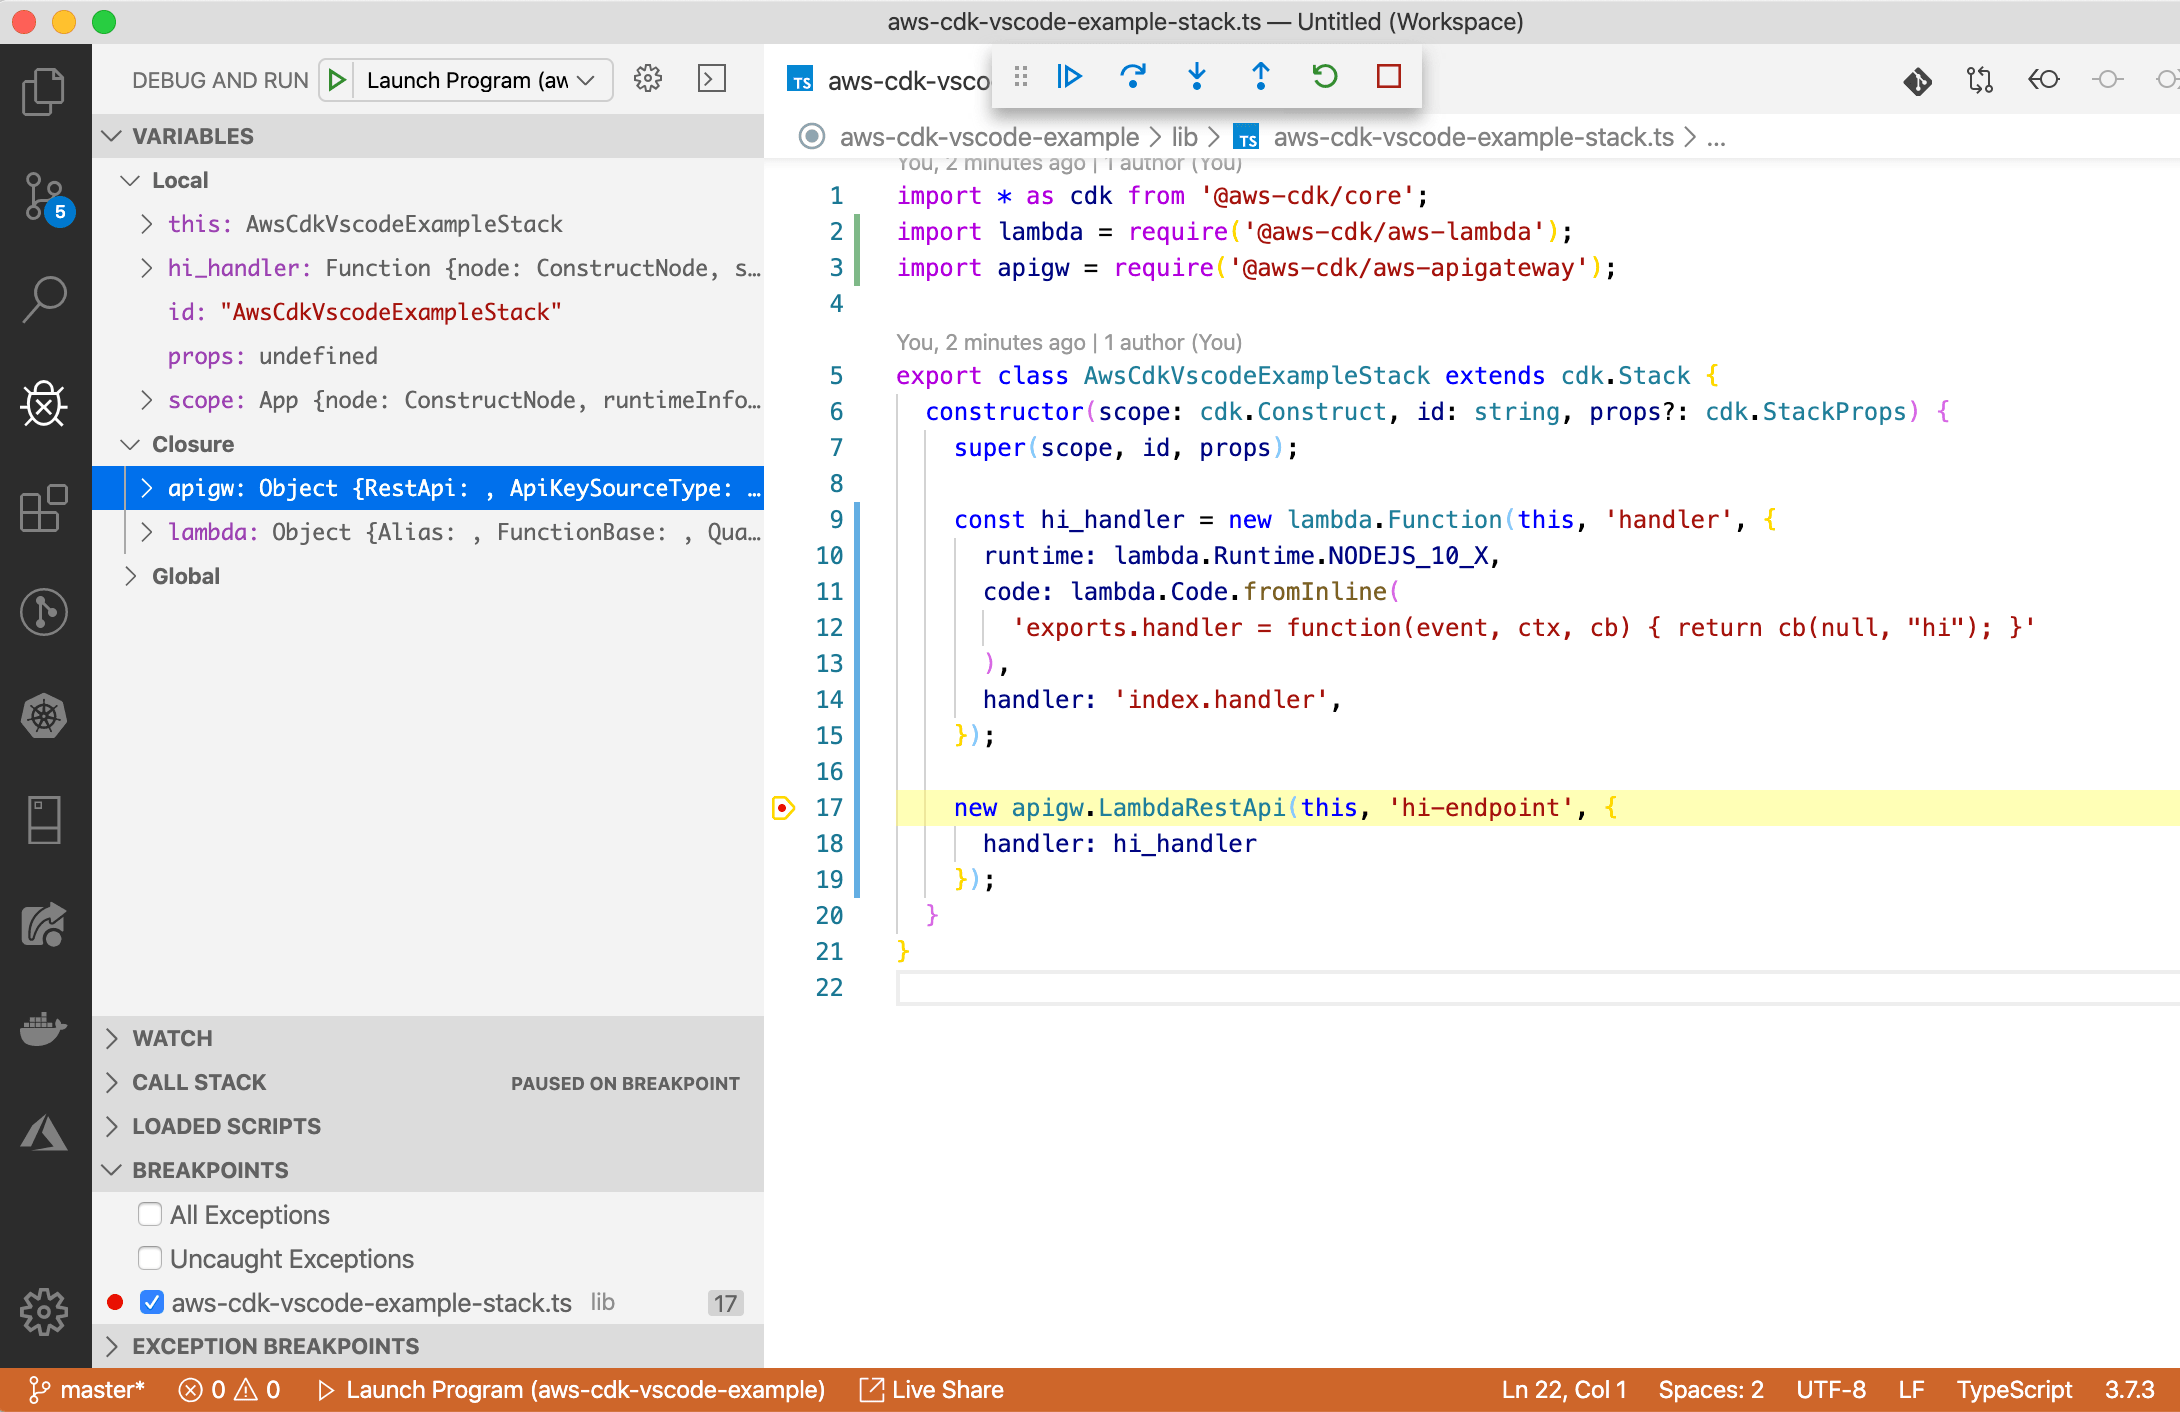
Try this yourself by setting a breakpoint on the API gateway resource; just click in the sidebar next to the line you'd like to halt execution at.
Now lets run the debugger by either clicking debug in the sidebar (the bug icon... it looks like a bug), or even better; click the Launch program button in the bottom left
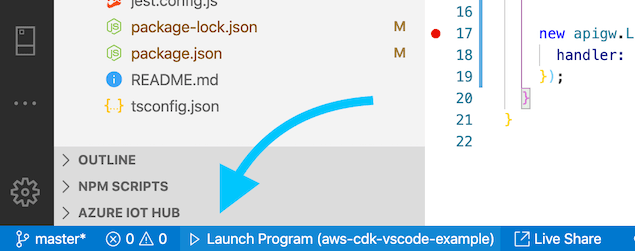
You should see the debugger fire up and halt where ever you set the breakpoint. This allows you to explore the callstack and variables that are in memory at that point of compilation.
Summary
If you're a heavy user of CDK you will likely run into problems occasionally that are just too difficult to resolve by analyzing CloudFormation failed stack logs. Instead it can be really handy to have this debugging technique handy to check underlying objects in memory are in fact doing what they should be doing.
What did you think of this tip? Did it help you? I'd love to hear about other awesome tricks you use in CDK development, please hit me up on Twitter @nathangloverAUS.